
pftui: Building a Hedge Fund in My Terminal
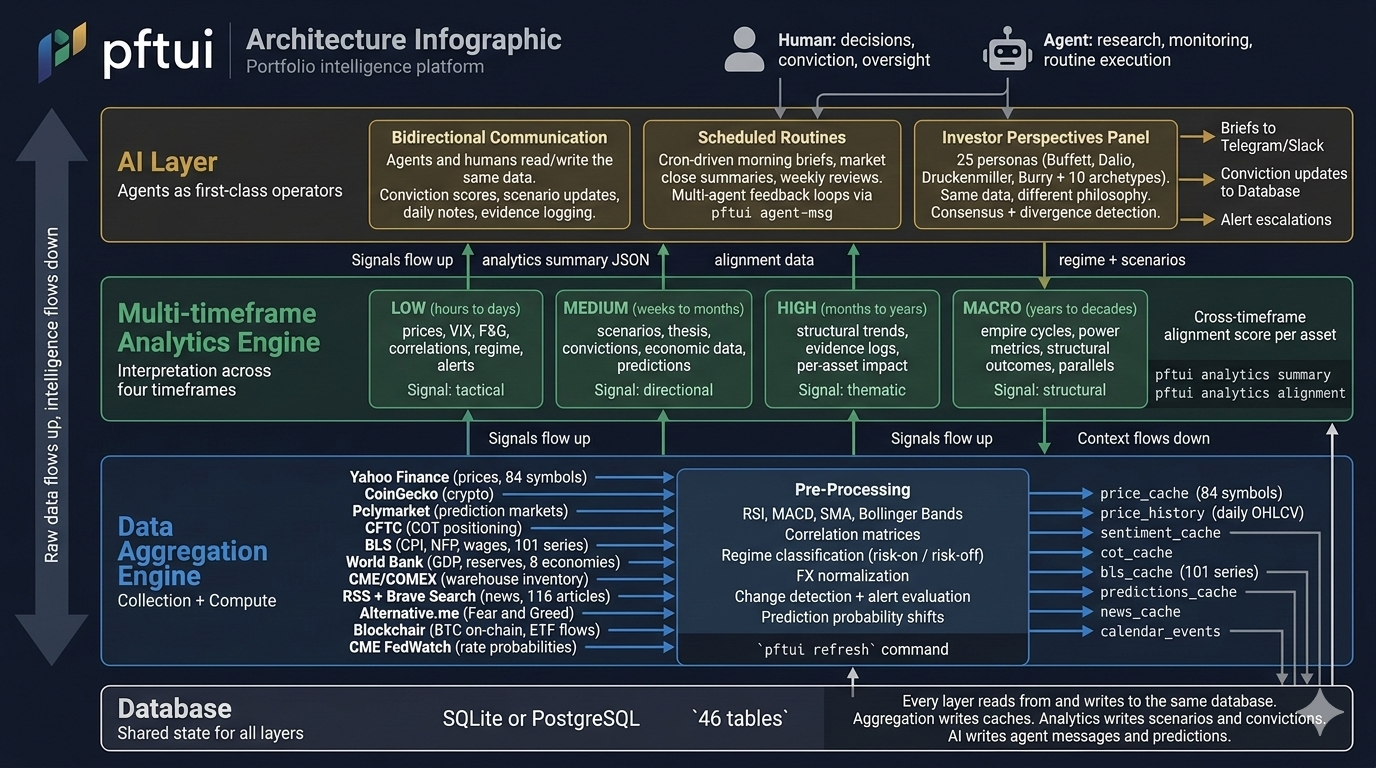
For the past several months I have been building a thing called pftui, which lives over at www.pftui.com, and the aim was simple enough to say out loud:
I wanted to build a terminal based hedge fund grade analytics suite that I could plug my AI agent into.
Not a portfolio tracker and not another dashboard, but an analytics suite with the sort of data depth and methodological seriousness you would expect from an actual desk, running on my own machine, and built so that an AI agent can operate it as a first class user rather than as a chatbot bolted on the side.
In this post I will walk through why I felt the need to build it, how it is put together, and the four layers I ended up splitting it into.
Every input is adversarial
The obvious problem is that financial intelligence is scattered all over the place. Yahoo for prices, TradingView for charts, Reuters for news, FRED for economic data, Twitter for sentiment, CoinGlass for flows, CME for COMEX, Polymarket for odds. My agent was doing the same thing from the other side, burning fifteen web searches every morning to reassemble a picture of what happened overnight. Both of us doing redundant work, and neither of us with a single place where any of it persisted.
That is the annoying problem, and it is the one everybody tries to solve, but it isn’t the real one.
The real one is that in 2026 every single one of those inputs is actively trying to trick you, and most of them are quite good at it.
The news is not information, it is positioning. No politician, CEO or central banker is speaking for your benefit, they are speaking for their backers. When an asset manager’s CEO goes on television to warn about oil, he is not helping you, he is talking his book while he builds the other side of it. When a central banker tells you inflation is transitory, the more interesting question is what he is buying personally. Their statements are data about their own positioning, not data about reality, and reading them as reality is how you end up holding the bag very politely.
The price action is not a neutral record either. Prices are the visible output of power dynamics between institutional actors, so when you see a move you are looking at the result of somebody with much better information than you acting on it. Most people read a chart like a weather report, when it is closer to a set of tracks left behind by something you never saw.
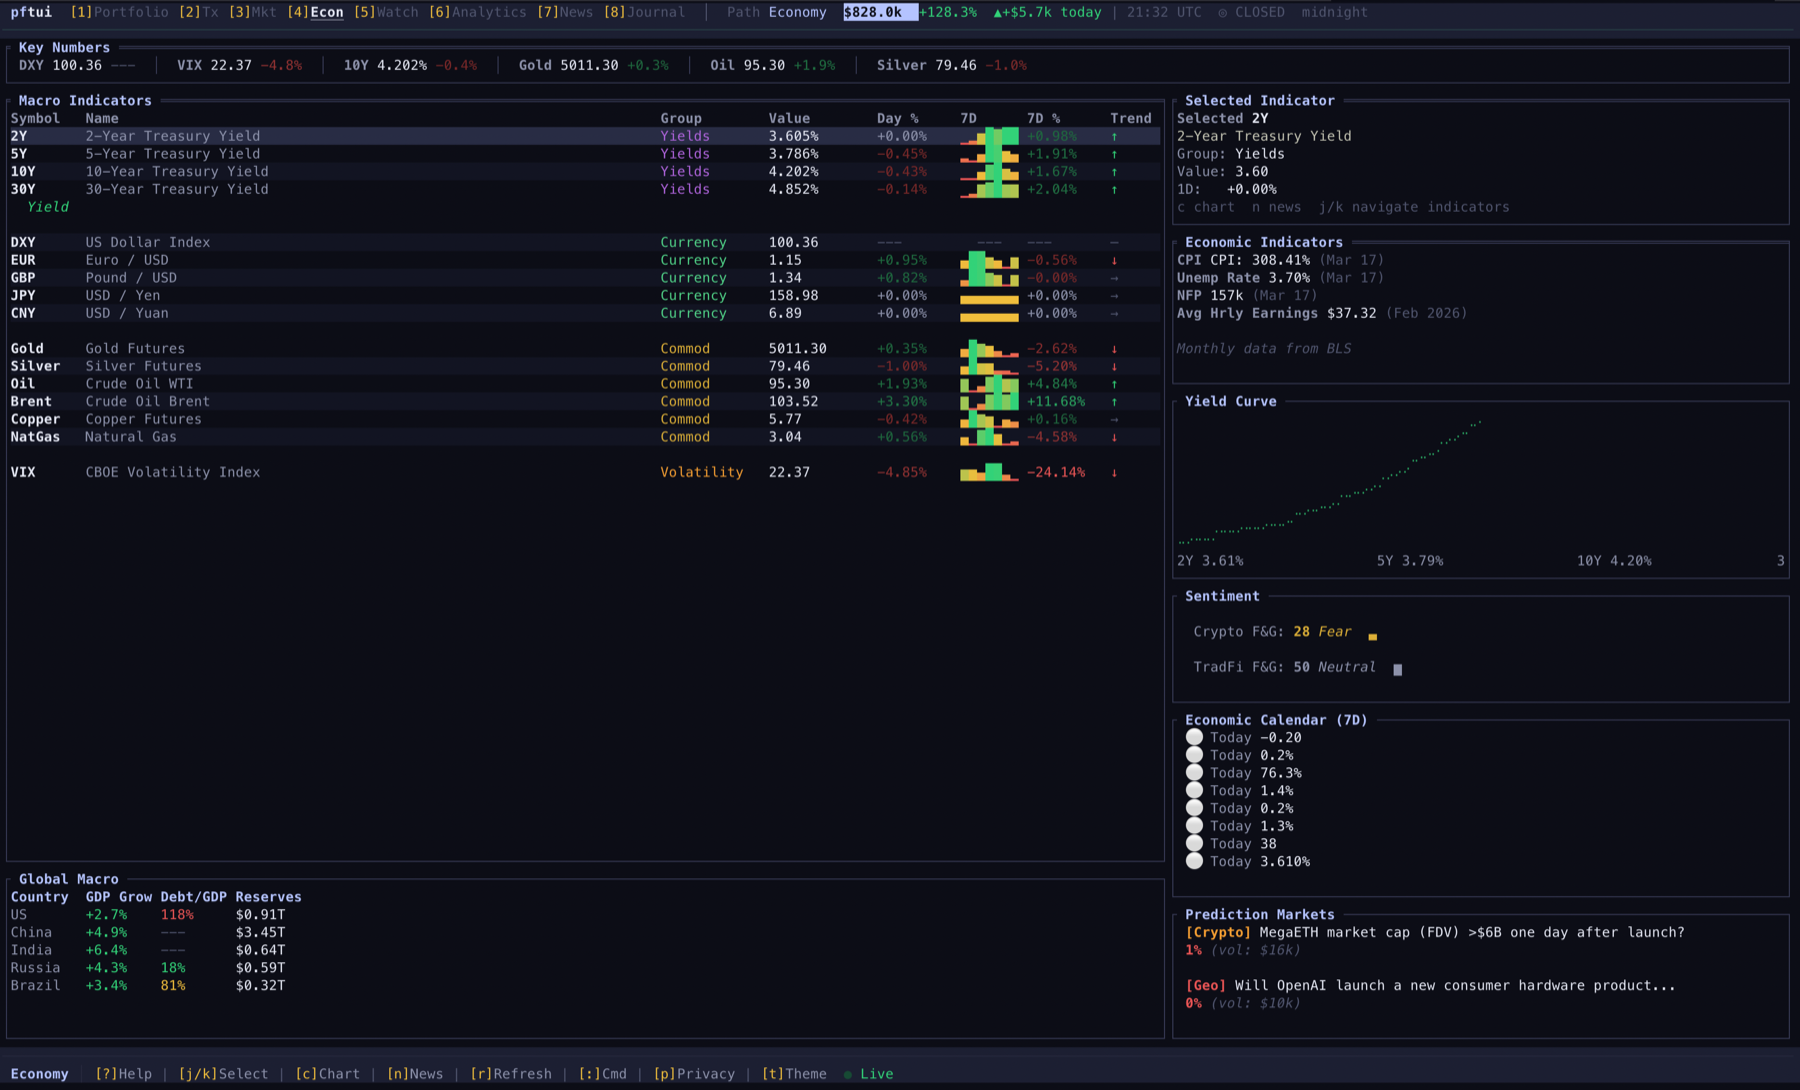
The macro data is managed. Revised, rebased, seasonally adjusted, methodology changed, released late, and restated two prints later when nobody is looking. I am not claiming some grand conspiracy here, only that a number which is politically load bearing tends to get treated like a number which is politically load bearing. pftui has a quarantine flag on economic series for exactly this reason, and it does get used.
And all of it is hyper financialised. Every asset is now a leveraged claim on some other asset, wrapped, tokenised, rehypothecated and sold back to you as exposure. Custody risk sits underneath price risk in almost every position most people hold, and in a crisis it is the custody risk that bites first.
Wrap all of that in an attention economy whose whole business model is keeping you anxious, refreshing and reactive, and what you get is an environment optimised against exactly the sort of person who checks it sporadically on his phone, gets emotional about it, and forgets what he claimed last week. Which is me, obviously.
You can’t fix any of that by reading more, because more feeds just means more surface area to be played across. What helps is having a system with a memory and a scoreboard that you own outright, and that nobody gets to re-narrate at you later.
A few things fell out of that as design rules. They are written down at the top of the system as first principles, and the agents have to read them before every run:
- Follow the money, not the narrative. The question is never what they said, it is where the capital went and whether that matches the story. Every divergence between the narrative and the flows is a signal, and the bigger the divergence the bigger the signal. If all you can cite is what somebody said then you don’t have analysis, you have a headline.
- Structural forces beat cyclical data. Empire cycles and power transitions play out over decades, regime shifts over years, economic releases over months, and price action over days. The lower layers get all of the attention and the higher layers drive all of the outcomes, so when they conflict I want the structural read to win.
- Cash is a position, not indecision. It is the most aggressive thing you can hold when the range of outcomes is wide. The system’s job is not to push me into deploying, it is to track both narratives with equal rigour and tell me when one of them decisively wins. Never manufacture conviction, and don’t be afraid of “I don’t know yet”.
- Both sides of every trade exist for a reason. If you can only argue one side then you don’t understand the position. State the bull case, state the bear case, and name the specific evidence that would flip you from one to the other.
- Complexity is not intelligence. If it takes ten paragraphs then it is probably wrong. “Gold is down while oil is up, so someone knows when this ends” is worth more than a page of hedging.
None of that is a new idea. Plenty of people will tell you to follow the money. The difference is whether it is a nice thought you have in the shower, or whether it is wired into a machine that checks it every morning whether you feel like it or not.
Why the terminal, and why an agent
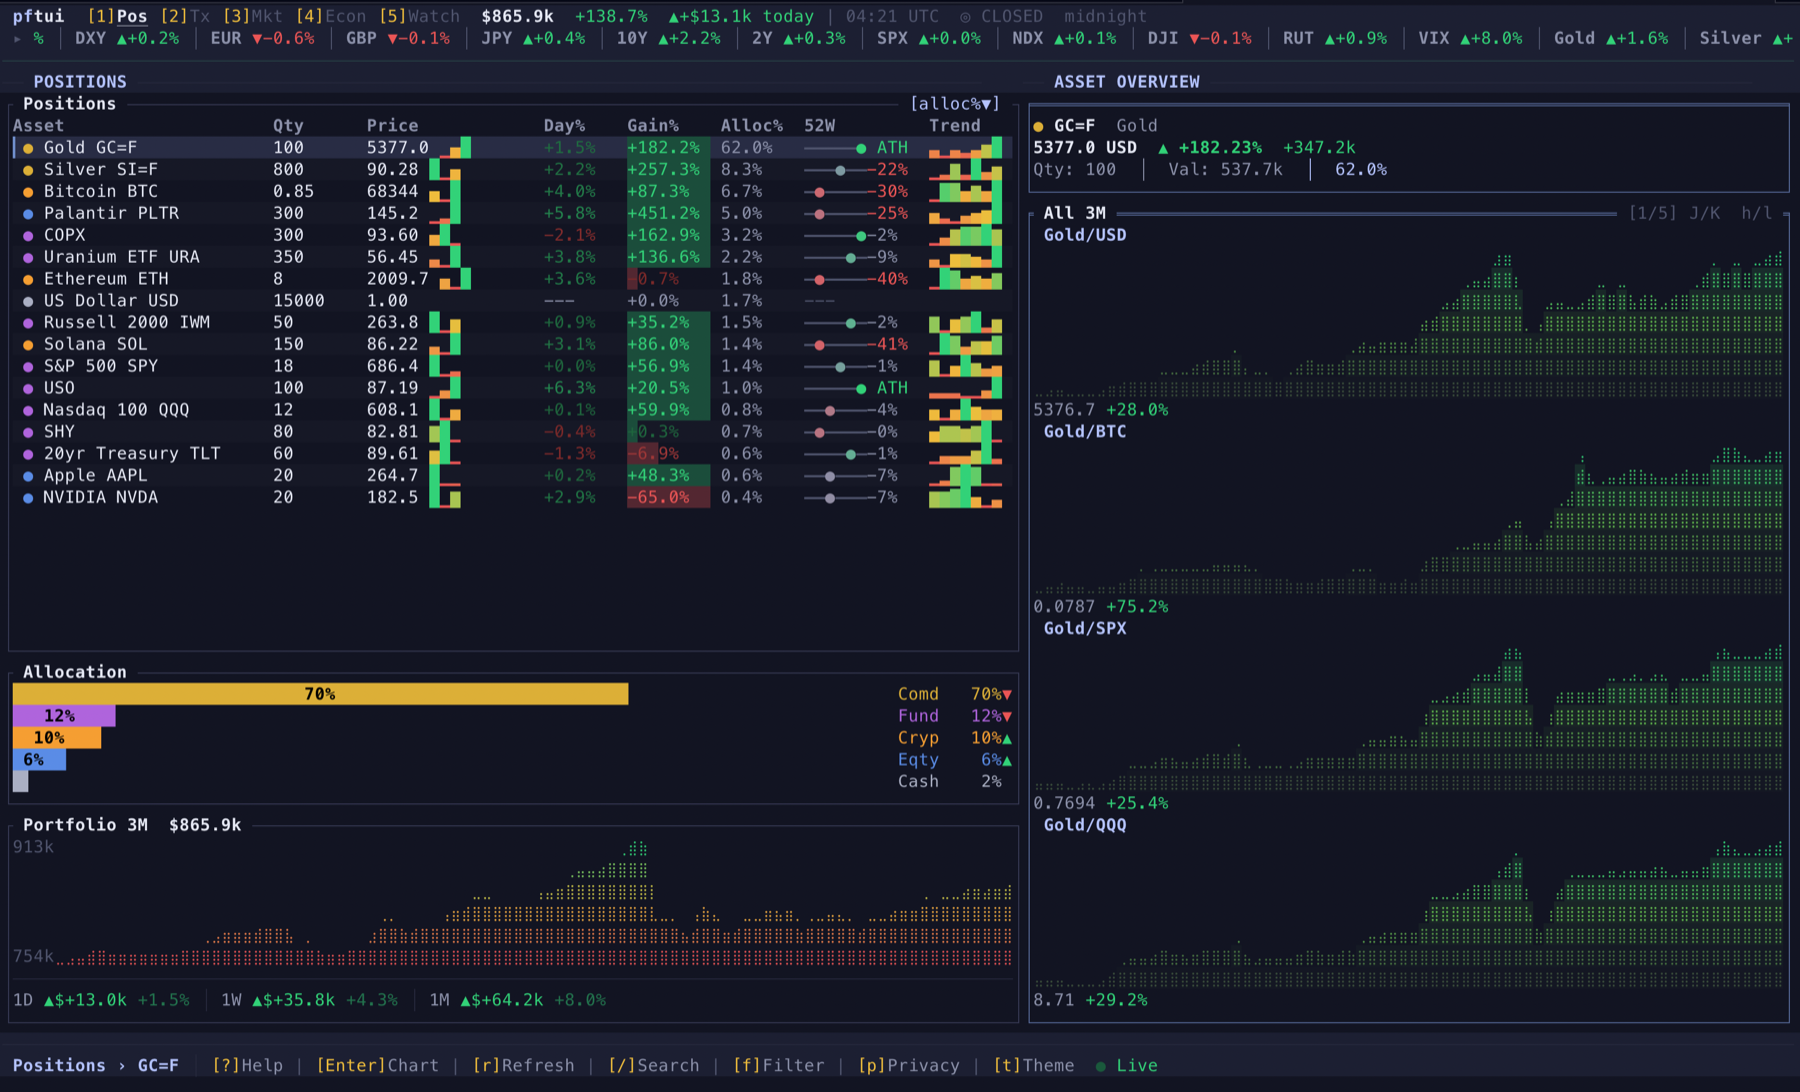
The terminal half is easy to justify. A TUI starts instantly, works over SSH, uses nothing next to an Electron app, and lives in the same tmux session as everything else I do all day. It also forces density on you, and I wanted Bloomberg information density rather than Robinhood simplicity. If a panel has empty space then it should be showing me more data.
The agent half is the more interesting bit. Most tools are built for humans and have agent support retrofitted afterwards, and pftui does it the other way around. Every feature ships as a CLI command with --json output, the database schema is documented for an agent to read directly, and the recommended way to install it is to tell your coding agent to go and set it up with you.
The reasoning is that a human alone and an agent alone both fail, just in opposite directions. I check markets sporadically, I get emotional, and I forget what I claimed about gold last week. An agent has none of those problems, and none of my judgement either. No skin in the game, no feel for when a read is wrong, and no authority to decide anything.
Put the two on the same data with the same tools and you get discipline plus conviction. The agent doesn’t get tired or frightened by a headline, and it can be made to write down what it thought last Tuesday so that neither of us can pretend otherwise later on.
The stack
Four layers, and each one is only allowed to do its own job. Data flows up, context comes back down, and every layer reads and writes the same local database.
1. Data
The bottom layer collects and stores. Nineteen plus sources, all pulled by a single pftui data refresh: prices across 84 symbols from Yahoo and CoinGecko, CFTC commitment of traders positioning, COMEX warehouse inventory, 101 BLS economic series, CME FedWatch rate probabilities, oil term structure, sovereign gold and BTC holdings, Polymarket odds, Fear and Greed, ETF flows, on-chain metrics, and news from RSS and Brave. One command, instead of eight browser tabs and fifteen web searches!
Have a look at what most of that list is. Positioning, inventory, flows, odds and holdings. It is weighted towards what people are doing rather than what they are saying, which is principle one showing up in the source list. News is in there too, but it is in there as something to be checked against the flows rather than as the thing that sets the story.
Two rules shaped this layer more than anything else.
Zero keys and zero config. The core works with no API keys and no account at all. If you have to sign up to three services before you can see your own portfolio then you close the tab, so I made sure you don’t have to. Optional keys (Brave, FRED) make it better, but nothing gates it.
Local first, and non negotiable. It is a SQLite file on my machine. What I hold, what I paid, what I am watching, none of it touches a server I don’t own. Privacy mode masks every monetary value on a keypress, so I can screenshot the thing without publishing my net worth. Postgres is there for multi agent setups, but SQLite is the right default. If self custody is sovereignty for the assets then it applies to the record of the assets too.
Storage is layered as well, and enforced by tests rather than by good intentions. L0 raw ingest, L1 canonical series with freshness deadlines, L2 derived caches that must be rebuildable from scratch, L3 append only ledgers, and L4 accumulated knowledge. Every table has to declare which layer it lives in and name the thing that reads it. No consumer, no table.
2. Mechanical
This is the layer I care most about, and the one that took longest to get honest.
The mechanical layer computes, deterministically, with no opinion in it. Same inputs, same outputs, every time, in Rust, using decimals rather than floats because money is not a floating point number. Indicators, correlation matrices, regime classification, cycle engines, and the whole signal intelligence stack.
That last one is the part that resembles what I was reaching for. It sweeps 50+ signal emitters across every timeframe from 1 to 90 trading day bars and every entry lag, then measures each configuration’s hit rate, false positive rate, forward return, drawdown and spacing. Whatever survives goes through walk forward out of sample folds and overfitting gates before the system will call any of it robust. Tops and bottoms are optimised separately, because the indicator that catches a top is rarely the one that catches a bottom.
Out the other end comes a live proximity read: how close are we, in time and in price, to the next cycle extreme, under several different cycle length models shown side by side rather than blended together into one confident looking number.
This layer exists because price action lies to you, and it cannot be talked into anything. It has no mood and no incentive, and it gives me the same answer at 3am on a red day as it did on a green one.
The rule that governs it is that it describes and it never prescribes. It emits mechanical state, and the expectation that state mechanically implies. It does not emit “buy”, it does not size a position, and it does not tell me what to do. I had to re-scope it at one point when it started drifting towards verdicts, because a machine that tells you to buy things is a very different and much worse product than a machine that tells you what is true.
The other rule is sample honesty. There have been two, maybe three completed Bitcoin cycles. Two or three! Every number in that engine is a measured fact standing on a sample that small, so the system reports frequencies rather than probabilities at low n, gates its verdicts behind explicit tiers, and pre-registers what it is testing before it tests it. That discipline is the only thing separating this from confident fiction, and it lives in the code rather than in a paragraph of prose asking the model nicely.
3. Analytical
Above the mechanics sits interpretation, and it is organised by timeframe rather than by asset. That turned out to be the most useful structural decision in the whole project, and it is the hierarchy principle from earlier turned into an architecture.
Four analytical layers run in parallel over the same data:
- LOW (hours to days) - prices, volatility, correlations, regime, alerts. Tactical.
- MEDIUM (weeks to months) - scenarios, thesis, convictions, economic data, predictions. Directional.
- HIGH (months to years) - structural trends, evidence logs, per asset impact. Thematic.
- MACRO (years to decades) - empire cycles, power metrics, structural outcomes, historical parallels. Structural.
Each layer uses different data at a different cadence. Signals flow up, and context constrains downward, so the decade view is allowed to overrule the day view rather than the other way around. Left to my own devices I will read a red candle and a scary headline and forget that I hold the position for reasons measured in years, so I wanted that constraint built in rather than left to my willpower on a bad morning.
The most valuable output is not any one layer’s read though, it is the relationship between them. You get an alignment score per asset, and more usefully you get the divergences. When the tactical layer is bullish and the structural layer isn’t, that gap is the interesting thing, and I wanted it surfaced as a fact rather than left for me to spot on a good day.
Sat on top of that is scenario modelling and impact ranking (shock oil to $100 and watch what it does to every position, and in what order), regime monitoring, risk analytics, portfolio simulation against declared strategy models, and catalyst ranking with countdowns.
4. Agentic
The top layer is where the agents live, and where the loop closes.
Agents don’t get a special API. They get the same CLI I use, with --json on everything, reading and writing the same database the TUI renders from. That symmetry is the whole design. There is no agent state and human state, there is one state, and both operators are looking at it.
What the agents do here is judgement work. Interpreting the mechanical layer against news, sentiment and cross market context. Running external research and triangulating sources. Writing structured per asset views with a direction, a conviction and their stated blind spots. Filing falsifiable predictions. Escalating the things that need me. Writing the daily briefs and the intelligence reports, which get published on the site. Four timeframe analysts run in parallel, one per layer above, and their views aggregate into a deterministic convergence classification rather than a vibe.
Then comes the part that makes it a system rather than a very expensive generator of plausible text.
Every view that gets expressed leaves a scored residue. Predictions carry explicit falsification conditions and get auto scored against what happened. Calibration is measured by conviction level and by timeframe, so the system can tell me where I am well calibrated and where I am reliably overconfident, and clamp my confidence accordingly.
A blind analyst sees only the raw data, with none of my journal, thesis or focus. The average distance between its conviction and the house view is the run’s sycophancy measurement. An antithesis analyst maintains the strongest coherent opposite worldview it can build, denied my thesis, and files its own predictions to its own scoreboard, so the bear case gets a track record instead of a debating slot. A shadow book mechanically executes whatever the system recommended and marks it against what I actually did, and against doing nothing at all.
None of those measurement voices are allowed to vote in the convergence. They exist to be collided with. The organising principle is that every claim the system makes has to eventually meet something that can prove it wrong, mechanically rather than rhetorically, because correction that only lives in a prompt is advisory, and advisory means ignorable.
There is a specific failure I was designing against here. Point an ordinary chatbot at your portfolio and ask it what it thinks, and it will tell you that you have made some very reasonable choices. It has read your journal and it knows what you want to hear. An agreeable machine in an adversarial environment is worse than no machine at all, because all it does is hand you back your own bias with some numbers attached to it. The blind analyst, the antithesis and the scoreboards are all there to make that failure mode measurable.
The system dashboard
All four layers eventually have to land somewhere I can actually look at, and that ended up being the system dashboard. One page per tracked asset, currently BTC, gold, SPX and the dollar, plus tabs for macro, the portfolio and system health.
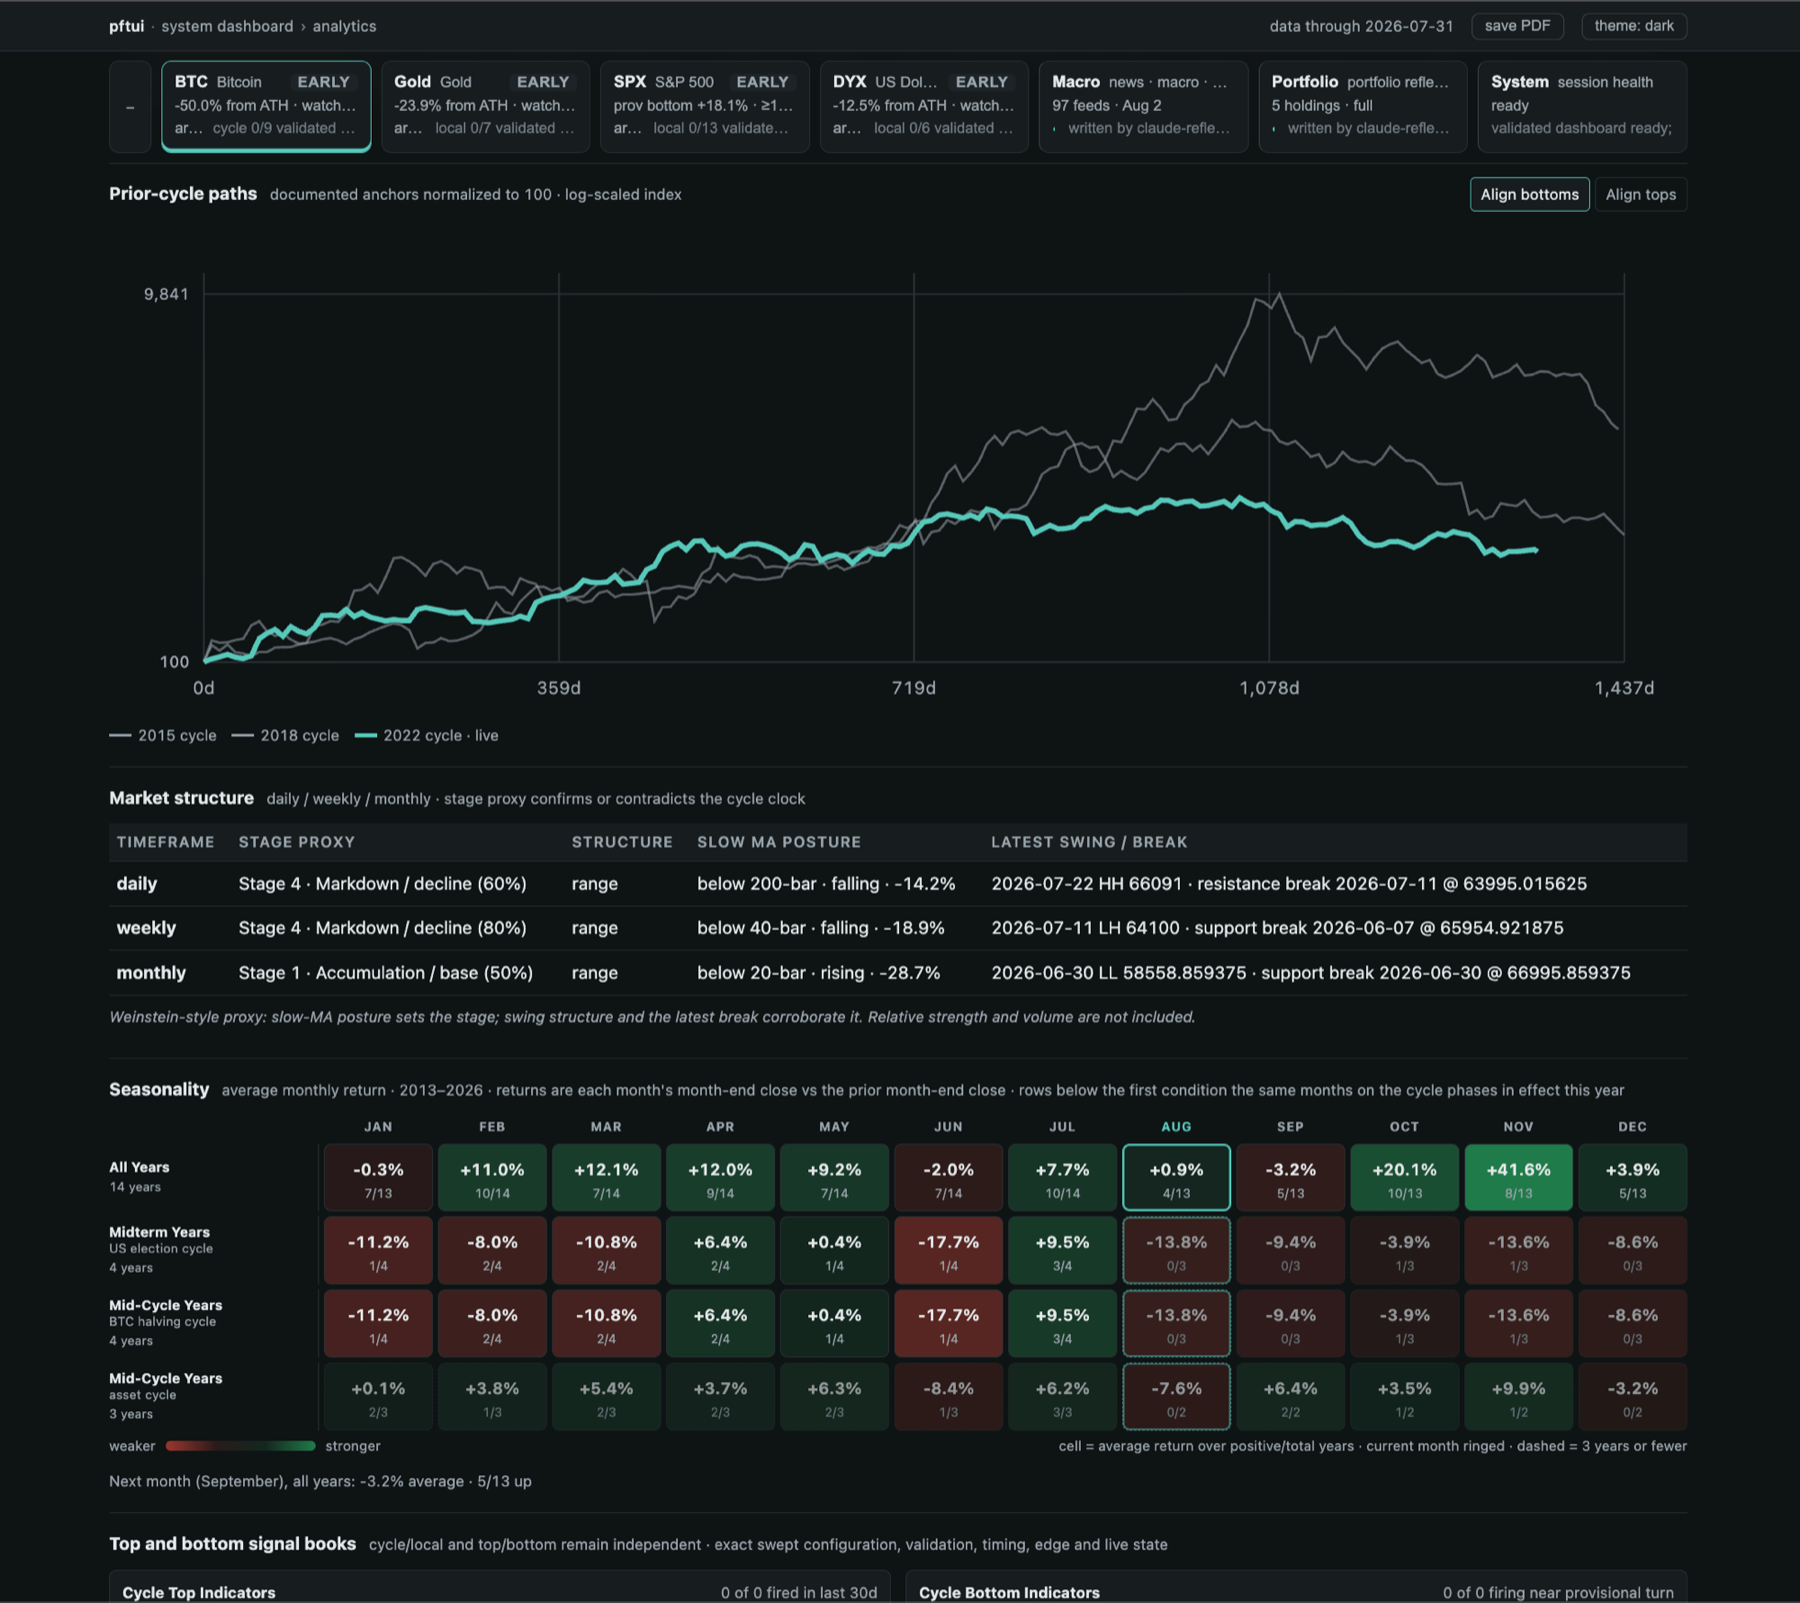
The top chart overlays the current cycle on every prior one, normalised to 100 and log scaled, so you can line them up by their bottoms or by their tops and see where this one sits against 2015 and 2018. Underneath it is a Weinstein-style stage proxy running on daily, weekly and monthly, which either corroborates the cycle clock or argues with it. On the day I grabbed this the daily and weekly were reading Stage 4 markdown while the monthly read Stage 1 accumulation, which is exactly the kind of disagreement I want shown rather than averaged away.
Then seasonality, which is the bit I keep going back to. Average monthly return since 2013, but conditioned on the cycle phase in effect this year rather than blended across all history. Every cell carries its own sample count (7/13, 4/13, 2/3) and anything standing on three years or fewer gets a dashed border. November averages +41.6% across all years, on 8 of 13 up. That is a real number and it is also n=13, and the dashboard makes you look at both at once.
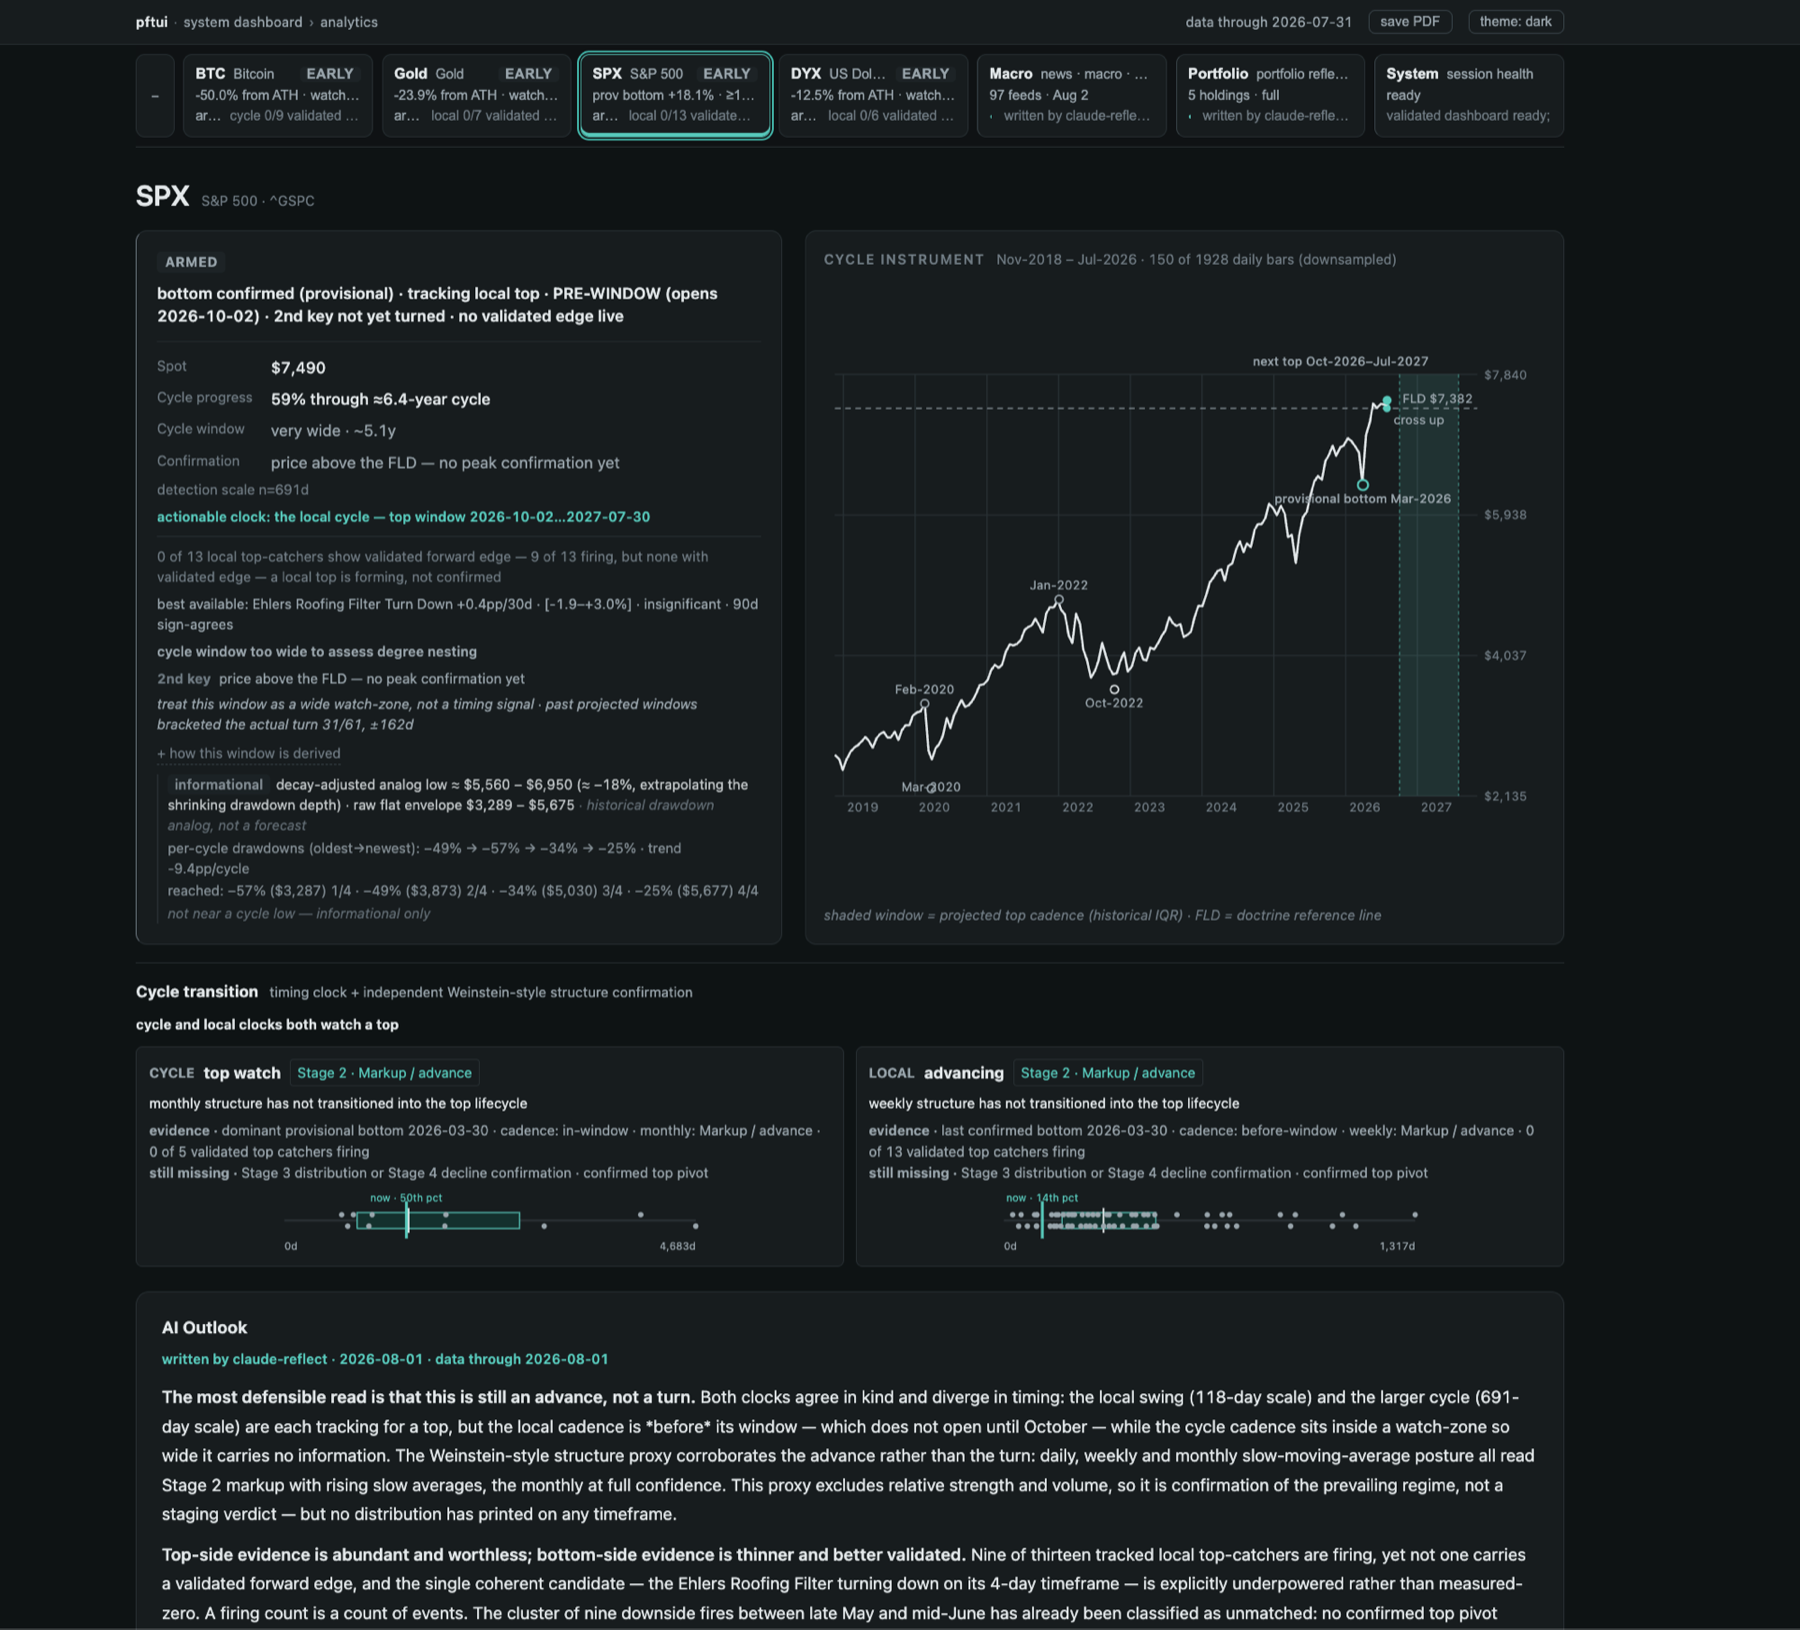
Per asset you get the cycle instrument: where we are in the cycle as a percentage, the projected next turn as a shaded window rather than a date, and the FLD line as the confirmation reference. And then the honesty furniture, which is most of what took the time to build. “Treat this window as a wide watch-zone, not a timing signal.” “Past projected windows bracketed the actual turn 31 of 61 times, plus or minus 162 days.” “Historical drawdown analog, not a forecast.” “Informational only.”
The signal books are the same idea. On this SPX page, 9 of 13 local top-catchers are firing, and 0 of 13 carry a validated forward edge. Nine signals screaming and none of them earning their keep. A lesser tool would print “9 sell signals” in red and let you draw the obvious conclusion.
At the bottom of each page sits the AI Outlook, written by the reflection agent, stamped with who wrote it and what date the data runs through. It is the agentic layer’s prose sitting directly underneath the mechanics that produced it, so I can check the argument against the numbers without changing screens. Its read that day: “Top-side evidence is abundant and worthless; bottom-side evidence is thinner and better validated.” That is the whole system working as intended, in one sentence.
What it is not
- Not a trading platform. It is read only. It never executes, never moves money, and never touches a broker with anything but a read. I make the decisions.
- Not prescriptive. Mechanical state and mechanically implied expectation, never orders.
- Not a conviction machine. It is happy to conclude that nothing is knowable today and that cash remains the position. It will not manufacture a view to justify its own existence.
- Not a service. No account, no cloud, no subscription. The database is a file, and it is yours.
- Not simple. Vim keybindings, eight views, eleven themes, braille charts, and 100+ CLI commands nested in a deep hierarchy on purpose. If you want simple then a spreadsheet is the right answer. The complexity is the point.
The thing I did not expect going in is how much of the work would turn out to be epistemics rather than engineering. Pulling nineteen data sources into SQLite is a weekend, and computing indicators over them is another weekend. Building something that will reliably tell you that you were wrong, and that can’t be talked out of it by the person who wrote it, took months, and it is the only part of this I would defend as novel.
I can’t unfinancialise the markets, I can’t make the news honest and I am not getting an unrevised CPI print any time soon. What I can do is own my own record, watch the money instead of the mouths, keep the timeframes in the right order, and score myself honestly enough that being wrong is something I find out about early rather than expensively.
A note on AI, while we are here
I don’t think there is much point arguing over whether all this AI stuff is good or bad. It is happening, it is the biggest paradigm shift I expect to see in my working life, and it is not going to be voted down. The only question left is what you personally do about it. It cuts both ways though.
On one side it is the greatest lever an individual has ever been handed. pftui is a fair example of that. What I have described in this post is, if I’m honest, a small desk’s worth of work: data engineering, a quant research stack, four analysts and a compliance function that argues with all of them. Ten years ago I would not have attempted it, not because the ideas were beyond me but because the sheer volume of implementation was. I built it in the evenings, on my own machine, alongside a full time job. And it isn’t just about building things either. Anything you have ever wanted to understand properly you can now sit down and learn, with something patient enough to explain it to you fifteen times over, which is a pretty big deal for those of us who never got on with the way school did it.
On the other side, the same technology is going to be pointed straight back at you, and it will be far better funded than anything you or I build. Feeds tuned to your psychology rather than your interests. Persuasion that adapts in real time. Pricing that knows exactly what you will tolerate. Surveillance, scoring, and programmable money with conditions attached to it. Everything I said earlier about an environment engineered to make you reactive gets a lot sharper when the thing doing the engineering knows you personally, and the attention economy we have now is the blunt version of that.
So the same tool that can make you sovereign can also be used to subordinate you, and which one you end up with mostly comes down to whether you are the one operating it or the one being operated on.
Which is my real point, and it has nothing much to do with markets. Whatever it is you care about, whether that is your money, your health, your work, your craft or your family, go and build the system that serves it, and do it now while the tools are cheap and open and pointed wherever you aim them. Own it, keep it local where you can, and let it compound. A system you own that gets a bit better every day will beat any amount of good intentions, and it will certainly beat renting your thinking from somebody whose incentives are not yours.
The window where one person can out-build an institution in their spare time is open right now, and I wouldn’t bet on it staying that way forever.
Apologies for the silence on here, the site was down for a while and I have been busy. More to come.
Thanks for reading!
Skylar